
视频信息
Seven ways to Profile Go Applications
by Dave Cheney
at Golang UK Conf. 2016
timetime|
$ time go fmt github.com/docker/machine
real 0m0.110s
user 0m0.056s
sys 0m0.040s
|
timego fmt github.com/docker/machine这里一共有3项指标:
realusersysrealusersystimetime/usr/bin/time|
vagrant@vagrant:~$ /usr/bin/time -v go fmt github.com/docker/machine
Command being timed: "go fmt github.com/docker/machine"
User time (seconds): 0.02
System time (seconds): 0.06
Percent of CPU this job got: 85%
Elapsed (wall clock) time (h:mm:ss or m:ss): 0:00.09
Average shared text size (kbytes): 0
Average unshared data size (kbytes): 0
Average stack size (kbytes): 0
Average total size (kbytes): 0
Maximum resident set size (kbytes): 18556
Average resident set size (kbytes): 0
Major (requiring I/O) page faults: 0
Minor (reclaiming a frame) page faults: 9925
Voluntary context switches: 430
Involuntary context switches: 121
Swaps: 0
File system inputs: 0
File system outputs: 32
Socket messages sent: 0
Socket messages received: 0
Signals delivered: 0
Page size (bytes): 4096
Exit status: 0
|
可以看到这里的功能要强大多了,除了之前的信息外,还包括了:
- CPU占用率;
- 内存使用情况;
- Page Fault 情况;
- 进程切换情况;
- 文件系统IO;
- Socket 使用情况;
- ……
timetimetime|
$ /usr/bin/time -l go fmt github.com/docker/machine
0.70 real 0.05 user 0.40 sys
11710464 maximum resident set size
0 average shared memory size
0 average unshared data size
0 average unshared stack size
8579 page reclaims
2571 page faults
0 swaps
0 block input operations
0 block output operations
0 messages sent
0 messages received
3 signals received
1118 voluntary context switches
1702 involuntary context switches
$
|
这里有:
- 内存使用情况
- Page Fault 情况
- IO 情况
- 进程切换情况
- Signal 情况
- ……
-toolexec-x|
$ go build -x fmt
WORK=/var/folders/wc/9tzsn1hd7c38tvc54kctn4100000gn/T/go-build846067626
mkdir -p $WORK/runtime/internal/sys/_obj/
mkdir -p $WORK/runtime/internal/
cd /usr/local/Cellar/go/1.9.1/libexec/src/runtime/internal/sys
/usr/local/Cellar/go/1.9.1/libexec/pkg/tool/darwin_amd64/compile -o $WORK/runtime/internal/sys.a -trimpath $WORK -goversion go1.9.1 -p runtime/internal/sys -std -+ -complete -buildid 2749cc50ea3a4ebcf
...
|
time-toolexec|
go build -toolexec=... github.com/pkg/profile
go test -toolexec=... net/http
...
|
-toolexec=timego build xxx.gotime go build xxx.go|
$ go build -toolexec="/usr/bin/time" cmd/compile/internal/gc
# runtime/internal/sys
0.09 real 0.01 user 0.02 sys
# runtime/internal/atomic
0.01 real 0.00 user 0.00 sys
# runtime/internal/atomic
0.02 real 0.00 user 0.00 sys
# runtime
1.60 real 1.90 user 0.12 sys
# runtime
0.00 real 0.00 user 0.00 sys
# runtime
0.02 real 0.01 user 0.00 sys
# runtime
0.01 real 0.00 user 0.00 sys
# runtime
0.00 real 0.00 user 0.00 sys
...
|
go buildgo testtoolstash/usr/bin/timegctrace=1|
$ env GODEBUG=gctrace=1 godoc -http=:8080
gc 1 @18446741350.644s 0%: 0.026+2.0+0.075 ms clock, 0.052+2.6/2.0/0+0.15 ms cpu, 4->4->0 MB, 5 MB goal, 4 P
gc 2 @18446741350.664s 0%: 0.12+1.5+0.049 ms clock, 0.25+0.50/1.2/0+0.098 ms cpu, 4->4->1 MB, 5 MB goal, 4 P
gc 3 @18446741350.695s 0%: 0.024+1.1+0.059 ms clock, 0.072+1.3/0.96/0+0.17 ms cpu, 4->4->1 MB, 5 MB goal, 4P
gc 4 @18446741350.714s 0%: 0.036+1.8+0.092 ms clock, 0.11+1.4/1.7/0+0.27 ms cpu, 4->4->1 MB, 5 MB goal, 4 P
gc 5 @18446741350.746s 0%: 0.021+2.2+0.055 ms clock, 0.087+2.5/2.1/0+0.22 ms cpu, 4->4->1 MB, 5 MB goal, 4 P
gc 6 @18446741350.770s 0%: 0.013+4.5+0.12 ms clock, 0.053+1.3/3.9/0+0.50 ms cpu, 4->4->1 MB, 5 MB goal, 4 P
gc 7 @18446741350.800s 0%: 0.020+2.5+0.056 ms clock, 0.083+2.4/2.5/0+0.22 ms cpu, 4->4->2 MB, 5 MB goal, 4 P
gc 8 @18446741350.817s 0%: 0.030+3.2+0.053 ms clock, 0.12+2.8/3.0/0+0.21 ms cpu, 4->4->2 MB, 5 MB goal, 4 P
gc 9 @18446741350.845s 0%: 0.041+4.7+0.10 ms clock, 0.16+1.6/4.3/0+0.40 ms cpu, 4->4->2 MB, 5 MB goal, 4 P
gc 10 @18446741350.881s 0%: 0.018+3.7+0.070 ms clock, 0.072+2.5/3.6/0+0.28 ms cpu, 4->4->2 MB, 5 MB goal, 4
...
|
这样的话,垃圾收集的信息都会被输出出来,可以帮助 GC 排障。如果发现 GC 一直都在很忙碌的工作,那恐怕内存管理上有可以改进的地方。
插曲一:Profiler 是如何工作的?SIGPROF性能分析注意事项
- 性能分析必须在一个可重复的、稳定的环境中来进行。
- 机器必须闲置。
- 不要在共享硬件上进行性能分析;
- 不要在性能分析期间,在同一个机器上去浏览网页!!😓;
- 注意省电模式和过热保护,如果突然进入这些模式,会导致分析数据严重不准确
- 不要使用虚拟机、共享的云主机,太多干扰因素,分析数据会很不一致;
- 不要在 macOS 10.11 及以前的版本运行性能分析,有 bug,之后的版本修复了。
- 机器必须闲置。
如果承受得起,购买专用的性能测试分析的硬件设备,上架。
- 关闭电源管理、过热管理;
- 绝不要升级,以保证测试的一致性,以及具有可比性。
如果没有这样的环境,那就一定要在多个环境中,执行多次,以取得可参考的、具有相对一致性的测试结果。
方法三:pprofpprofCPU 性能分析
10ms一个函数如果出现在数据中的次数越多,就越说明这个函数调用栈占用了更多的运行时间。
内存性能分析
1000栈(Stack)分配 由于会随时释放,因此不会被内存分析所记录。
由于内存分析是取样方式,并且也因为其记录的是分配内存,而不是使用内存。因此使用内存性能分析工具来准确判断程序具体的内存使用是比较困难的。
阻塞性能分析
阻塞分析是一个很独特的分析。它有点儿类似于 CPU 性能分析,但是它所记录的是 goroutine 等待资源所花的时间。
阻塞分析对分析程序并发瓶颈非常有帮助。阻塞性能分析可以显示出什么时候出现了大批的 goroutine 被阻塞了。阻塞包括:
sync.Mutex阻塞性能分析是特殊的分析工具,在排除 CPU 和内存瓶颈前,不应该用它来分析。
一次只分析一个东西
性能分析不是没有开销的。虽然性能分析对程序的影响并不严重,但是毕竟有影响,特别是内存分析的时候增加采样率的情况。大多数工具甚至直接就不允许你同时开启多个性能分析工具。如果你同时开启了多个性能分析工具,那很有可能会出现他们互相观察对方的开销从而导致你的分析结果彻底失去意义。
所以,一次只分析一个东西。
对函数分析
testingtesting-cpuprofile=xxxxxxxx-memprofile=xxxxxxxx-memprofilerate=N1/N-blockprofile=xxxxxxxx如:
|
$ go test -run=XXX -bench=IndexByte -cpuprofile=/tmp/c.p bytes
goos: darwin
goarch: amd64
pkg: bytes
BenchmarkIndexByte/10-4 200000000 6.44 ns/op 1553.83 MB/s
BenchmarkIndexByte/32-4 200000000 7.41 ns/op 4318.84 MB/s
BenchmarkIndexByte/4K-4 10000000 210 ns/op 19455.95 MB/s
BenchmarkIndexByte/4M-4 5000 321910 ns/op 13029.39 MB/s
BenchmarkIndexByte/64M-4 300 5406798 ns/op 12411.94 MB/s
BenchmarkIndexBytePortable/10-4 100000000 13.8 ns/op 722.79 MB/s
BenchmarkIndexBytePortable/32-4 30000000 44.9 ns/op 712.86 MB/s
BenchmarkIndexBytePortable/4K-4 500000 2910 ns/op 1407.32 MB/s
BenchmarkIndexBytePortable/4M-4 500 2979323 ns/op 1407.80 MB/s
BenchmarkIndexBytePortable/64M-4 30 47259940 ns/op 1419.99 MB/s
PASS
ok bytes 18.689s
|
-run=XXXgo tool pprof|
$ go tool pprof bytes.test /tmp/c.p
|
对整个应用分析
testingruntime/pprofgithub.com/pkg/profiledefer profile.Start().Stop()|
import "github.com/pkg/profile"
func main() {
defer profile.Start().Stop()
...
}
|
pprofhttp|
import _ "net/http/pprof"
func main() {
log.Println(http.ListenAndServe("localhost:3999", nil))
...
}
|
pprof30秒- CPU 性能分析数据:
|
go tool pprof http://localhost:3999/debug/pprof/profile
|
- 内存性能分析数据:
|
go tool pprof http://localhost:3999/debug/pprof/heap
|
/debug/pprof/heapruntime.MemStatsHeapSys- 阻塞性能分析数据:
|
go tool pprof http://localhost:3999/debug/pprof/block
|
pprofpprof|
go tool pprof /path/to/your/binary /path/to/your/profile
|
binaryprofilebinaryprofilepprof|
go tool pprof /tmp/c.p
|
不是这样的,这样会发现显示 profile 里面是空的。
我们可以在命令行里分析:
|
$ go tool pprof bytes.test /tmp/c.p
File: bytes.test
Type: cpu
Time: Oct 22, 2017 at 8:41pm (AEDT)
Duration: 18.60s, Total samples = 16.38s (88.06%)
Entering interactive mode (type "help" for commands, "o" for options)
(pprof) top
Showing nodes accounting for 16300ms, 99.51% of 16380ms total
Dropped 30 nodes (cum <= 81.90ms)
Showing top 10 nodes out of 12
flat flat% sum% cum cum%
7560ms 46.15% 46.15% 7560ms 46.15% runtime.indexbytebody /usr/local/Cellar/go/1.9.1/libexec/src/runtime/asm_amd64.s
5950ms 36.32% 82.48% 5950ms 36.32% bytes.indexBytePortable /usr/local/Cellar/go/1.9.1/libexec/src/bytes/bytes.go
2180ms 13.31% 95.79% 15880ms 96.95% bytes_test.bmIndexByte.func1 /usr/local/Cellar/go/1.9.1/libexec/src/bytes/bytes_test.go
420ms 2.56% 98.35% 420ms 2.56% runtime.usleep /usr/local/Cellar/go/1.9.1/libexec/src/runtime/sys_darwin_amd64.s
190ms 1.16% 99.51% 190ms 1.16% bytes.IndexByte /usr/local/Cellar/go/1.9.1/libexec/src/runtime/asm_amd64.s
0 0% 99.51% 15880ms 96.95% bytes_test.benchBytes.func1 /usr/local/Cellar/go/1.9.1/libexec/src/bytes/bytes_test.go
0 0% 99.51% 410ms 2.50% runtime.mstart /usr/local/Cellar/go/1.9.1/libexec/src/runtime/proc.go
0 0% 99.51% 410ms 2.50% runtime.mstart1 /usr/local/Cellar/go/1.9.1/libexec/src/runtime/proc.go
0 0% 99.51% 410ms 2.50% runtime.sysmon /usr/local/Cellar/go/1.9.1/libexec/src/runtime/proc.go
0 0% 99.51% 15810ms 96.52% testing.(*B).launch /usr/local/Cellar/go/1.9.1/libexec/src/testing/benchmark.go
(pprof)
|
websvg
这个图是 CPU 性能分析的图,这里可以直观的看出哪个地方最消耗 CPU,使用时间越多的,方块面积就越大。而且由于其继承关系清晰可见,我们可以很清楚的看到为什么它会消耗很多 CPU。
-svg-pdfgo tool pprof -help推荐阅读:
除了可视化 CPU 性能分析外,同样可以分析内存和阻塞。
内存性能分析:
|
$ go build -gcflags='-memprofile=/tmp/m.p'
$ go tool pprof --alloc_objects -svg $(go tool -n compile) /tmp/m.p > alloc_objects.svg
$ go tool pprof --inuse_objects -svg $(go tool -n compile) /tmp/m.p > inuse_objects.svg
|
- alloc_objects

- inuse_objects

阻塞性能分析
net/http|
$ go test -run=XXX -bench=ClientServer -blockprofile=/tmp/b.p net/http
$ go tool pprof -svg http.test /tmp/b.p > block.svg
|

Frame pointer 是整个 Unix/Linux 调试工具链的核心的东西。Frame Pointer 就是一个指向调用栈顶端的寄存器。
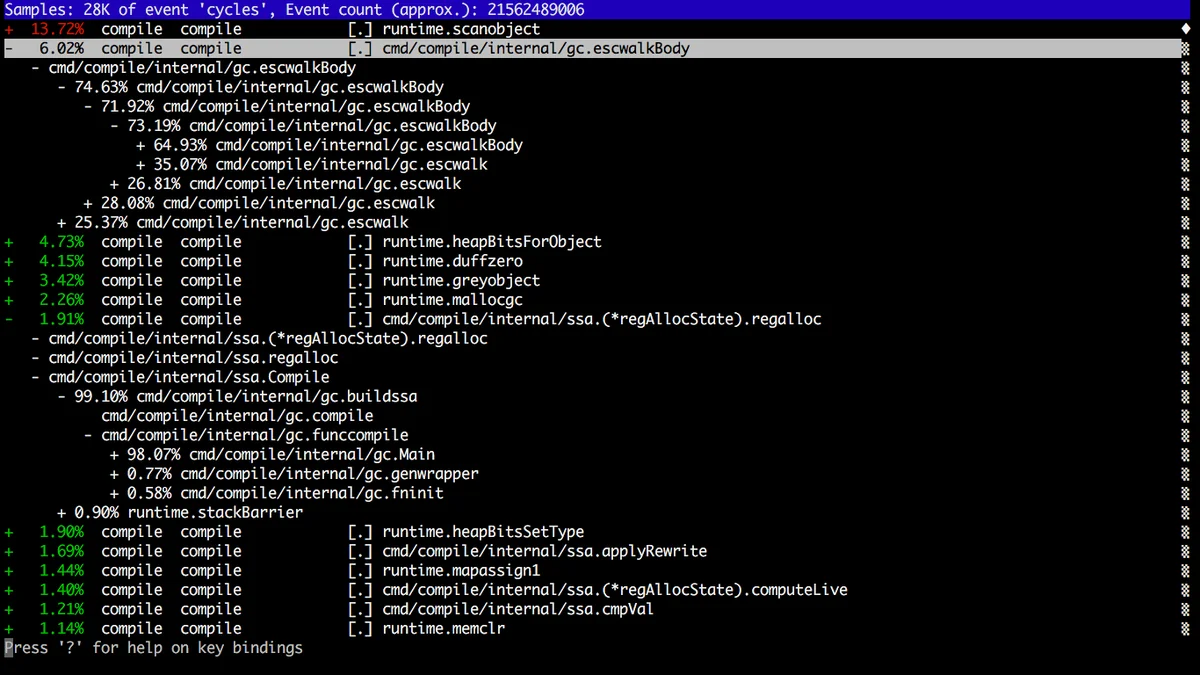
1.7perf-toolexec=|
$ go build -toolexec="perf stat" cmd/compile/internal/gc
|
perf record|
$ go build -toolexec="perf record -g -o /tmp/p" cmd/compile/internal/gc
$ perf report -i /tmp/p
|
火焰图(Flame Graph) 也是性能分析的利器。最初是由 Netflix 的 Brendan Gregg 发明并推广的。
X 轴显示的是在该性能指标分析中所占用的资源量,也就是横向越宽,则意味着在该指标中占用的资源越多,Y 轴则是调用栈的深度。
有几点需要注意:
- 左右顺序不重要,X 轴不是按时间顺序发生的,而是按字母顺序排序的
- 虽然很好看,但是颜色深浅没关系,这是随机选取的。
pprofperf/debug/pprof|
$ go build -gcflags=-cpuprofile=/tmp/c.p .
$ go-torch $(go tool -n compile) /tmp/c.p
|

在 Go 1.5 的时候,Dmitry Vyukov 在 runtime 里添加了一个新的性能分析工具,execution tracer profile。
|
$ go test -trace=trace.out path/to/package
$ go tool trace [flags] pkg.test trace.out
|
这个工具可以用来分析程序动态执行的情况,并且分析的精度达到纳秒级别:
- goroutine 创建、启动、结束
- gorouting 阻塞、恢复
- 网络阻塞
- 系统调用(syscall)
- GC 事件
这个工具目前介绍的文档不多,https://golang.org/pkg/runtime/trace/。只有很少量的文档,或许应该有一些文档、博客啥的描述一下。这里有几个文档可以看看:
-traceprofile=cmd/compile/internal/gc|
$ go build -gcflags=-traceprofile=/tmp/t.p cmd/compile/internal/gc
$ go tool trace /tmp/t.p
2017/10/23 20:59:09 Parsing trace...
2017/10/23 20:59:10 Serializing trace...
2017/10/23 20:59:10 Splitting trace...
2017/10/23 20:59:11 Opening browser
|
这会打开一个浏览器,显示:
- View trace
- Goroutine analysis
- Network blocking profile
- Synchronization blocking profile
- Syscall blocking profile
- Scheduler latency profile
点进去就可以看到各种分析。

pkg/profile|
import "github.com/pkg/profile"
...
func main() {
defer profile.Start(profile.TraceProfile).Stop()
...
}
|
不同的工具可以从不同的角度对你的应用进行分析。一般你不需要非得把上面提及的每个工具都用一遍,但是建议大家熟悉一下上面的工具,先从小的东西开始,当熟悉之后,在真正需要的时候,才可以快速的选择自己所需的工具来诊断问题。